graphs, boredom, and an activity reccommender
As part of my Computer Science “Career Path” course on Codecademy, it was suggested to me that I make a portfolio project where I use my knowledge of graphs to create a terminal app.
Now this isn’t very specific, so I had a hard time thinking of an idea for a couple of days. So I started asking my friends for suggestions so I could brainstorm together an idea, and a friend of mine who is in the hospital (get well soon!), and was therefore bored, suggested that I could make an activity recommender terminal app, so that he could get help thinking of activities to do during his recovery period.
The graph data structure is essentially a group of nodes (called vertices) connected by lines (called edges) to represent a certain kind of relationship between several objects. The graph data structure has an almost infinite amount of use cases; they are used in search engines for the internet, for GPS and navigation purposes like in Google Maps, and so on.
I found my friends suggestion particularly interesting. I could have each possible activity represented as a vertex in a graph, and have the edges of these vertexes be their associated moods or interests. My terminal app could then ask the user questions about how they're feeling, and then search a graph containing many different activities and their associated moods / interests, and give the user a list that's however long they choose containing different activities they might find enjoyable based on their interests and their mood. This would look like this:
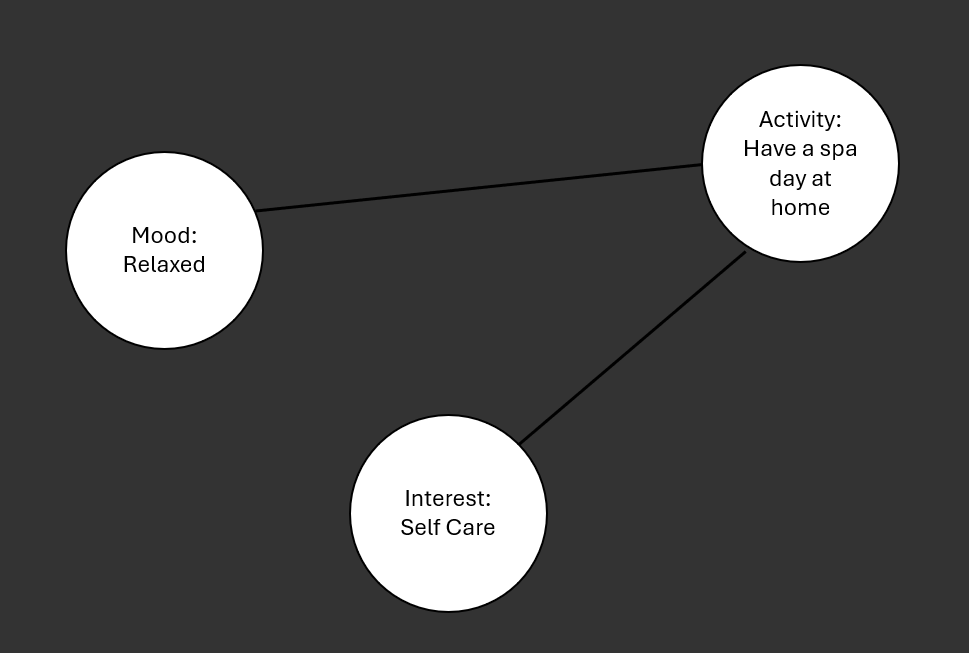
In this example, the activity vertex of having a spa day at home has edges (connections) to the relaxed mood vertex and the self care interest vertex. So if a user of my terminal app would input that he is interested in self care and feels relaxed, ideally the application would suggest to the user that they have a spa day at home.
For this project and terminal app to work, I had to do the following 4 things:
- Create a very large python dictionary of activities and their associated interests and moods
- Implement a graph data structure, and populate it accordingly with my activities, interests, and moods
- Implement a search that can be done with a given input list of moods and interests
- Implement all the logic necessary for a terminal game
1. The dictionary
I'm going to be honest, I kind of cheated for this part. Instead of handwriting a dictionary with 100 different activities and categorize them as needed (doing this would have taken hours), I asked Google's impressive new Gemini chat bot model to do it for me. I started out by prompting it to give me 100 different activities. Next I prompted it to tell me what kind of interests one would have to be interested in these activities, and what kind of moods they're in. Lastly I just asked it to represent all of this information in a python dictionary, which it happily did. The resulting python dictionary is 200 lines long, so here are some samples of what it contained:
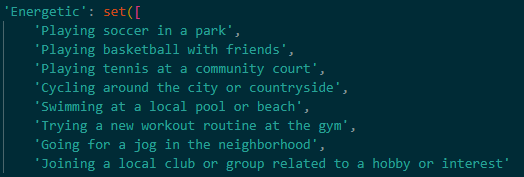
These are the activities associated with feeling energetic. A cool thing that Google's Gemini model did was that it put some activities in more than one category without explicitly being asked to. "Playing soccer in a park" was not only associated with the "Energetic" mood, but also with the "Sports and Fitness" interest category.
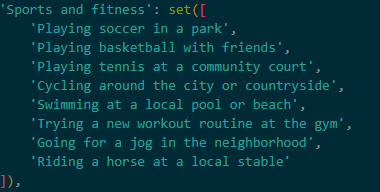
This way, similarly to our illustration, we can create a vertex representing the "playing soccer in a park" activity and set its edges (connections) to the "Energetic" vertex and the "Sports and fitness" vertex.
Creating and populating the graph
The implementation of the graph data structure was very standard, except for the method that searches for the most appropriate activities, but we'll get to that part later.
The rest of the implementation was very standard; I needed to be able to create instances of the vertices, add edges (connections) to them, and be able to ask a vertex to give me a list of all of its edges. From there I needed to be able to create an instance of a graph, add these vertices to it, and be able to create connections between all the vertices present in the graph. Another method the graph implementation had was the search for appropriate activities for the user, but that will be covered in its own section. The code that implements the functionality discussed here is below: (Please note, reading the code isn't necessary to follow along with this article).
class Vertex:
    def __init__(self, value):
        self.value = value
        self.edges = {}

    def add_edge(self, vertex, weight=0):
        self.edges[vertex] = weight

    def get_edges(self):
        return list(self.edges.keys())

class Graph:
    def __init__(self, directed=False):
        self.graph_dict = {}
        self.directed = directed

    def add_vertex(self, vertex):
        self.graph_dict[vertex.value] = vertex

    def add_edge(self, from_vertex, to_vertex, weight=0):
        self.graph_dict[from_vertex.value].add_edge(to_vertex.value, weight)
        if not self.directed:
            self.graph_dict[to_vertex.value].add_edge(from_vertex.value, weight)

    def return_nodes(self):
        return list(self.graph_dict.keys())
With that, our graph is implemented. The next step is to populate the graph with all the vertices and edges. To do this, I had to initialize the graph and create a starting vertex, so that the search could have a starting point.
I then iterated and went through every "key" of my AI generated activity dictionary. Each "key" in this dictionary is a mood or interest. For each of these keys, I created a vertex for it, and connected it to the starting vertex
Then I iterated over every "value" of the AI generated dictionary, which represents all the activities. For each of these values, I created a vertex for it.
The last iteration of the AI generated python dictionary was done to connect the mood and interest vertices to the activity vertices. The code to achieve this is pasted below: (Again, not necessary to read)
#create the graph
activity_graph = Graph(directed = False)
starting_vert = Vertex("Start")
activity_graph.add_vertex(starting_vert)
mood_interest_vertices = {}
mood_interest_vertices["Start"] = starting_vert

# populate the graph data structure using the AI generated
# activity_categories python dictionary

for mood_interest in activity_categories.keys():
    vertex = Vertex(mood_interest)
    activity_graph.add_vertex(vertex)
    activity_graph.add_edge(starting_vert, vertex)
    mood_interest_vertices[mood_interest] = vertex

activity_vertices = {}
for activities in activity_categories.values():
    for activity in activities:
        if activity not in activity_vertices:
            vertex = Vertex(activity)
            activity_graph.add_vertex(vertex)
            activity_vertices[activity] = vertex


for mood_interest, activities in activity_categories.items():
    mood_interest_vertex = mood_interest_vertices[mood_interest]
    for activity in activities:
        activity_vertex = activity_vertices[activity]
        activity_graph.add_edge(mood_interest_vertex, activity_vertex)
Overall, this code sets up a graph where each mood interest is connected to a starting vertex, and each activity is connected to its corresponding mood interest vertex, creating a structure that represents relationships between mood interests and activities, which is what we wanted.
I was curious as to how this graph looked so I spent a bit of time figuring out how to use a graph library called "networkx" that I could use to visualize my graph. Here is a picture of our activity graph:
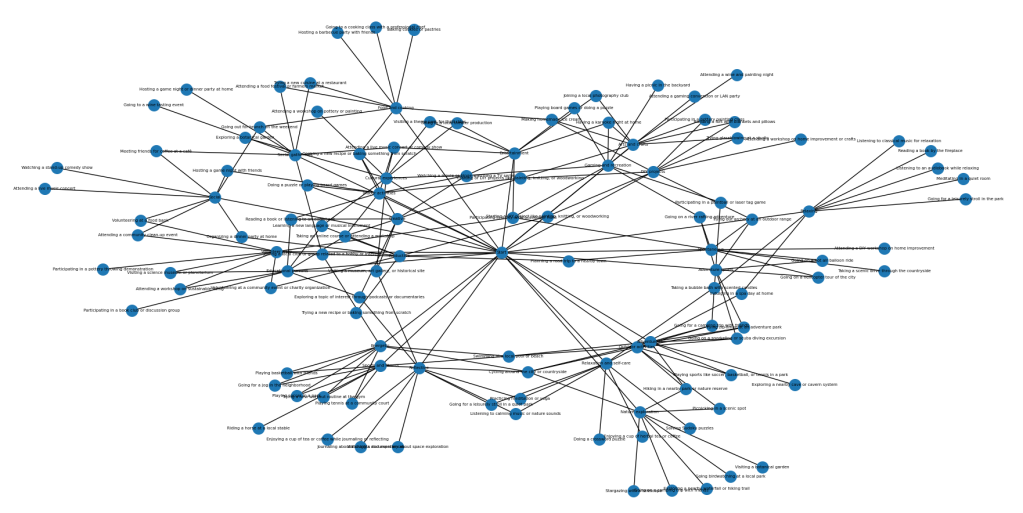
I'm aware that this is completely unreadable, so let's zoom in:
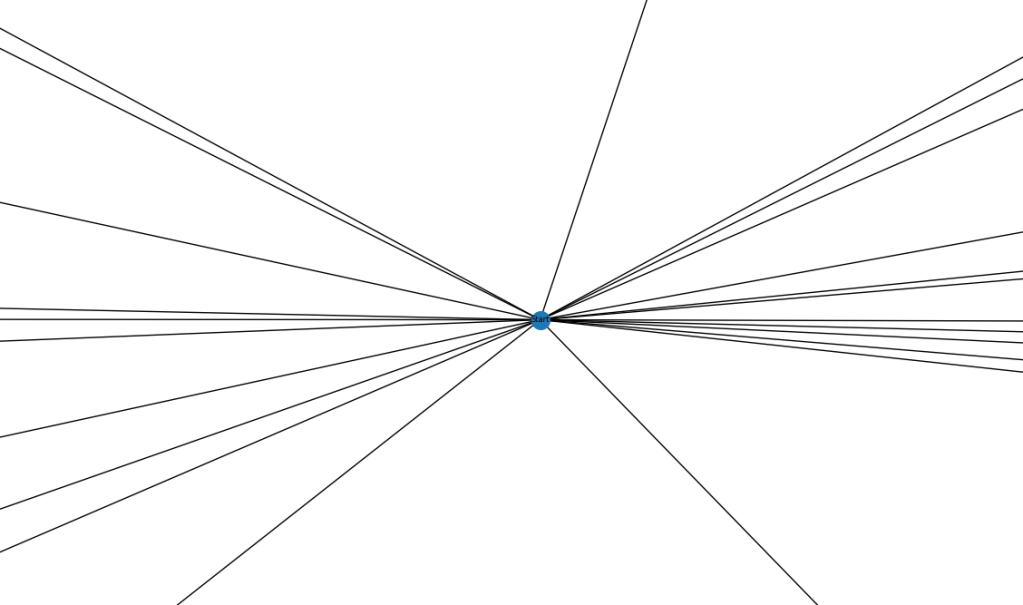
Here is the starting vertex, and all of its connections to the different moods and interests.
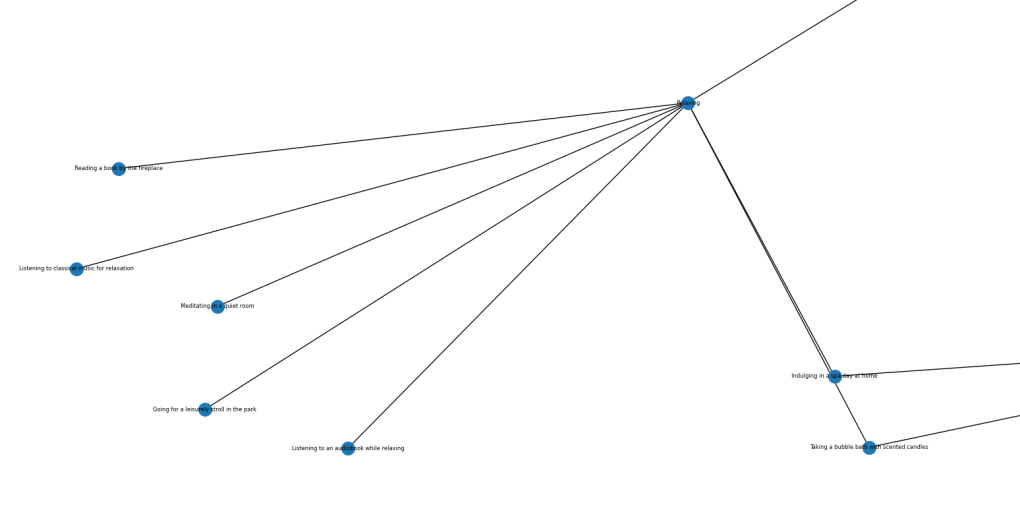
This is the "relaxed" vertex, with all of its associated activities.
The Search
At the beginning of this project I thought I needed more traditional graph search algorithms like a depth first search, or a breadth first search.
As I was getting all of the activity data onto the graph it occurred to me that it wouldn't have to be so complicated; Given a list of interests and a limit on the number of results desired, the search traverses the graph starting from the starting vertex. The search looks through all of the interests and moods and gives us all of the activities that are connected to the relevant interests and mood of the user. It evaluates activities connected to these interests and moods. It does this by looking through all of the connections of all the activities, and seeing how many of these connections are interests and moods that the user has specified. By tallying the number of shared interests between each activity and the input list, it ranks activities based on their relevance. The method then returns a selection of activities, ensuring both diversity and relevance within the specified limit.
The diversity is ensured by randomizing all the activities that are tied for last place. For example, if we have 3 different activities at the end of our recommendation list that all have 1 match to our users interests, but there are 5 total possible activities with 1 match, then it will randomly select the 3 activities out of the 5 possible ones. We do this so we make sure that we don't get the same results each time, and that we instead get differing results when possible. The code that does this is shown below: (Reading the code is unnecessary)
def search(self, interest_list, lim):
    check_dict = {}
    check_list = []
    first_key = next(iter(self.graph_dict))  # Get the first key
    start_vertex = self.graph_dict[first_key]
    for mood_interest_key in start_vertex.get_edges():
        mood_interest = self.graph_dict[mood_interest_key]
        if mood_interest.value in interest_list:
            for activity in mood_interest.get_edges():
                check_list.append(activity)

    for activity_key in check_list[1:]:
        activity = self.graph_dict[activity_key]
        int_count = 0
        for edge in activity.get_edges():
            if edge in interest_list:
                int_count += 1
        check_dict[activity.value] = int_count
    sorted_items = sorted(check_dict.items(), key=lambda item: item[1], reverse=True)
    # Extract keys from sorted items into a list
    sorted_keys = [item[0] for item in sorted_items if item[0] != "Start"]
    if len(sorted_keys) > lim:
        final_keys = sorted_keys[:lim]
        if len(set(check_dict.values())) < lim:
            last_value = check_dict[final_keys[-1]]
            tie_keys = [key for key, value in check_dict.items() if value == last_value and key not in final_keys]
            num_to_fill = lim - len(final_keys)
            final_keys.extend(random.sample(tie_keys, num_to_fill))
    else:
        final_keys = sorted_keys
    return final_keys, len(check_dict)
The "big picture" of this, is that it will give you a list of activities, in descending order based on how many matches each activity has to all of the moods and interests that you specify in the terminal app.
4. Putting it together
The final piece of the puzzle is to connect all of these interesting parts of the terminal game to a file that, when run, the user can actually interact with.
Doing this is relatively simple compared to the search algorithm and data structure implementations, but is also tedious.
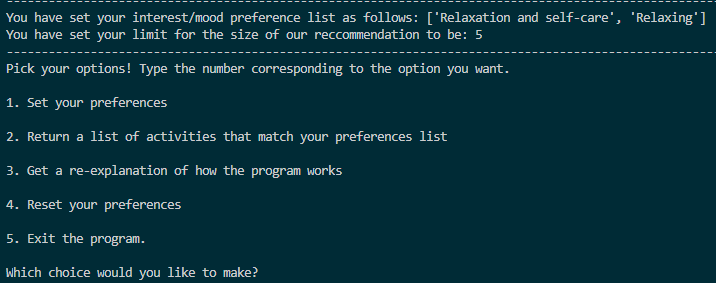
Upon execution, users are prompted with a welcome message and an explanation of how the program operates. Users are then presented with a menu of options, including setting their mood/interest preferences, retrieving activity recommendations based on those preferences, receiving an explanation of the program's functionality, resetting preferences, or exiting the program.
The set_preferences function allows users to specify their mood and interest preferences by selecting from a list of options. Users can continue adding preferences until they choose to stop or until they have selected all available options. Additionally, users are prompted to set the limit for the number of activity recommendations they wish to receive.
The find_activities function utilizes the search method from the graph implementation to identify activities that align with the user's specified preferences. It then displays the recommended activities based on relevance to the user's interests and mood.
Overall, the terminal application provides users with a simple and interactive way to discover activities tailored to their preferences. Below is a demonstration of the terminal app:
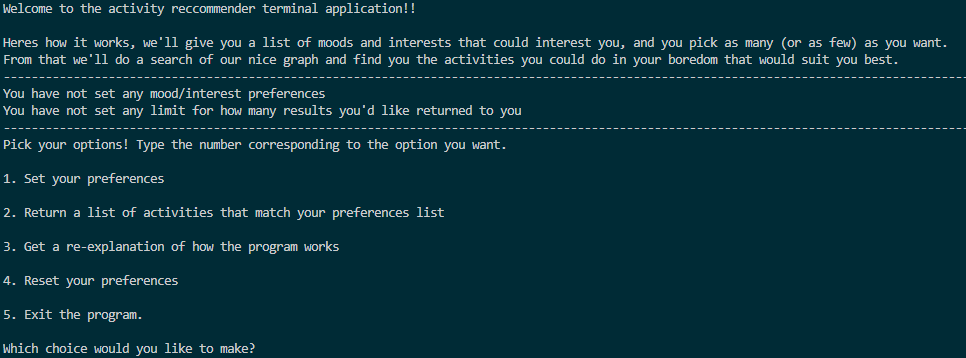
Here is the starting prompt for the user. Upon typing "1" into the terminal to set your preferences, you will be greeted with the following:

Should you decide that you want to add another category to your preference list, perhaps the mood "Relaxed", and to set your list limit to 5 you will see the following:
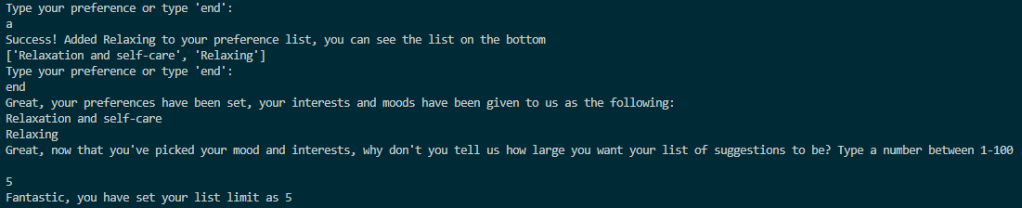
You will then be redirected to the "main menu" again, but with a key change, in the beginning before you set your preferences it said at the top of the main menu that you had no preferences set. Now, it tells you what you've picked, and is ready for you to type "2" to perform your search.
Upon typing 2, you will run the graph search to find the best activities for you. Here are the results.
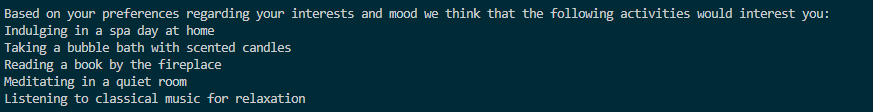
Let's take a look at our activity data to verify that the list is sorted in descending order of matches to the users interests:
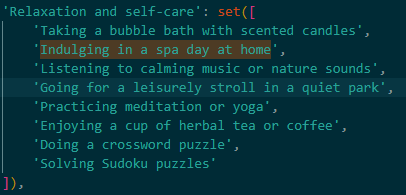
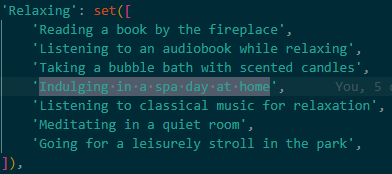
Here we can see that "Indulging in a spa day at home" is at the top of the list, and this is because it is included in both the relaxed mood category and the self care category. Naturally, "Listening to classical music for relaxation" is lower down on the list, because while it is a relaxing activity to do, it hasn't been deemed as self care by Google's Gemini model when it generated all of these activities. Since it has less matches than "Indulging in a spa day at home", it is lower on the list.
Conclusion
Despite encountering some whimsical suggestions like "Going on a helicopter tour of the city," which may seem far-fetched and likely stems from Google's Gemini being too creative for its own good, the overall outcome of this project is highly satisfactory. By leveraging the graph data structure, I successfully organized a diverse range of activities, allowing for efficient storage and retrieval of information. Implementing a custom algorithm enabled the program to intelligently match activities to user preferences and interests, optimizing the recommendations provided. Hopefully this can be of some use to my friend in the hospital, and can give him a couple of good suggestions on what to do while he's holed up in his room recovering.